

ESnet Measurement & Analysis Intern Felix Renken is a senior student from Technische Universität Berlin, majoring in Computer Science with a focus on Media Technologies and Signal Processing. Originally from a rural area near Hamburg in northern Germany, he moved to Berlin to pursue his college education. He arrived in Berkeley in March and will be going home in early July.
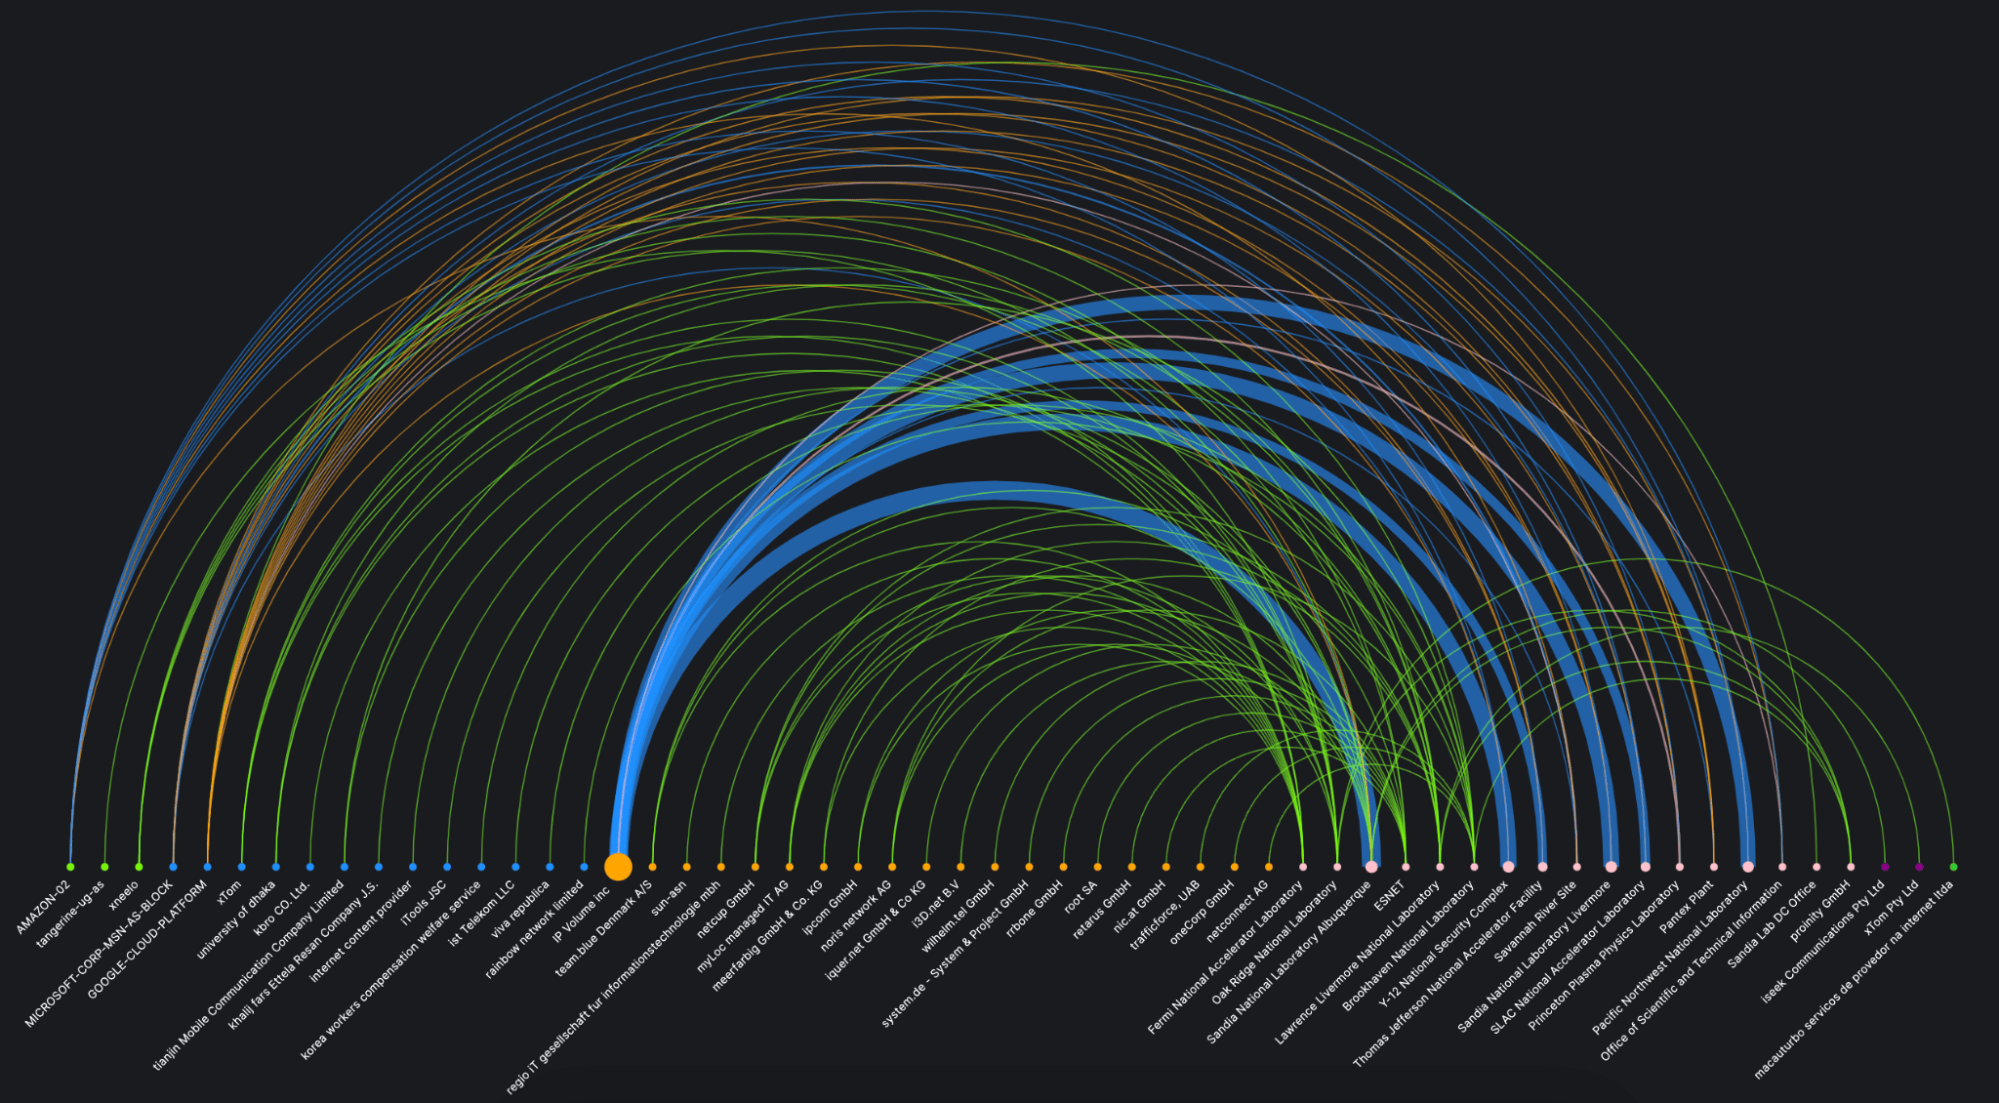
During his internship, Felix worked on developing an open-source Grafana plugin for visualizing network data that can be used in ESnet’s Stardust system, which collects precise network measurement data and allows users to retrieve information about specific equipment over a given time range. (Learn more about Stardust via this talk by Ed Balas and Andy Lake.) Felix’s plugin enables users to visualize various data collected by Stardust, revealing the relationship between pairs of data from different destinations for a single source and showcasing common attributes in nodes and links along with the option to visualize AS paths. The plugin is currently undergoing the Grafana community plugin review process; the source code is available on GitHub. It is installed on Stardust too, for anyone who wants to check it out.
Want to know more? On June 30, Felix gave an ESnet Policy, Innovation, Practices, and Engineering (PIPE) talk about the Arc Diagram Plugin and his internship experience.
What brought you to ESnet?
During my search for interesting internship opportunities, I came across ESnet’s student program and contacted Marc Körner and Katrina Turner to get more information on the projects they supervise. I eventually applied for the “Data Visualization of Network Measurement Data” project. It encompasses the development of an open-source tool that visualizes network data in an exciting way. The opportunity of getting work experience in a research environment greatly appealed to me. And, of course, the chance to spend time in California!
What is the most exciting aspect of your field right now?
The cross-disciplinary nature of visualizing data is particularly interesting to me. It utilizes principles from design, statistics, and computer science, offering opportunities to learn from diverse perspectives.
How was Berkeley different from Berlin? What fun things did you do here?
Berkeley and Berlin are distinct in so many aspects. Berkeley is, of course, much smaller in size than Berlin, and I really enjoyed being in a city that is less hectic. People here seem more relaxed. And the fact that Berkeley is somewhat shaped by its university was also something that I’m not used to from Berlin or any other German city. Cycling here was scarier than in Berlin though. Another thing is the accessibility to the fantastic nature around Berkeley. I went hiking a lot and will definitely miss being in close proximity to beautiful trails when going back to Germany. Other fun things I did were camping and eating a lot of burritos.
You must be logged in to post a comment.