ESnet is proud to welcome Rede Nacional de Ensino e Pesquisa (RNP), the national research and education network of Brazil, as an official collaboration partner on the perfSONAR project. The official announcement on the perfSONAR website is here. RNP joins five other organizations (ESnet, GEANT, Indiana University, Internet2, and the University of Michigan) committed to providing dedicated resources that develop and maintain the perfSONAR software.
Even though RNP is now becoming an official project member, they have been part of the perfSONAR community for the past 15 years. RNP has used their own perfSONAR fork for eight years and recently moved to the baseline version of perfSONAR across RNP’s 27 points of presence. The use of the perfSONAR branch code will provide network engineers and customers with improved abilities to maintain their network and validate on-demand circuit use.
Going forward, RNP will be a key contributor in several areas. Iara Machado will be working in conjunction with perfSONAR’s existing steering committee members to provide executive level guidance for the project. Additionally, Marcos Schwarz will join the perfSONAR leadership team to not only spearhead the RNP development team, but also help manage the day-to-day development of the project with existing partner institutions. Initial interests include containerization, perfSONAR as microservices, standard display and analysis packages, and possibly making their circuit validation tool available to the broader community. RNP’s experience and insight will be invaluable to the perfSONAR project going forward.
ESnet and the entire perfSONAR collaboration are excited to officially have them on the team. Having partners like RNP strengthens the perfSONAR initiative and helps ensure a bright future in its continued role as a critical piece of infrastructure for high-performance scientific networks.
Scientific discovery increasingly relies on the ability to perform large data transfers across networks operated by many different providers (including ESnet) around the globe. But what happens when a researcher initiates one of these large data transfers and data movement is slow? What does “slow” even mean? These can be surprisingly complex questions and it is important to have the right tools to help answer them. perfSONAR is an open source software tool designed to measure network performance and pinpoint issues that occur as data travels across many different networks on the way to a destination.
perfSONAR has been around for more than 15 years and is primarily maintained today by a collaboration of ESnet, GEANT, Indiana University, Internet2, and the University of Michigan. perfSONAR has an active community that extends well beyond the five core organizations that maintain the software with more than 2000 public deployments that span six continents and hundreds of organizations. perfSONAR deployments are capable of scheduling and running tests that calculate metrics including (but not limited to) how fast a transfer can be performed (throughput), if a unit of information makes it to a desired destination (packet loss), if so how long did it take (latency) and what path did it take to get there (traceroute). What is novel about perfSONAR is not just these metrics, but the set of tools to feature these metrics in dashboards built by multiple collaborating organizations. These dashboards aim to clearly identify patterns that signify potential issues and provide the means to drill-down into graphs that give more information.
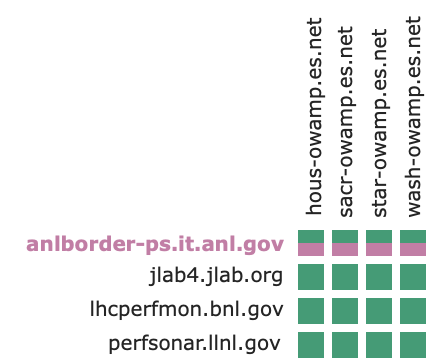
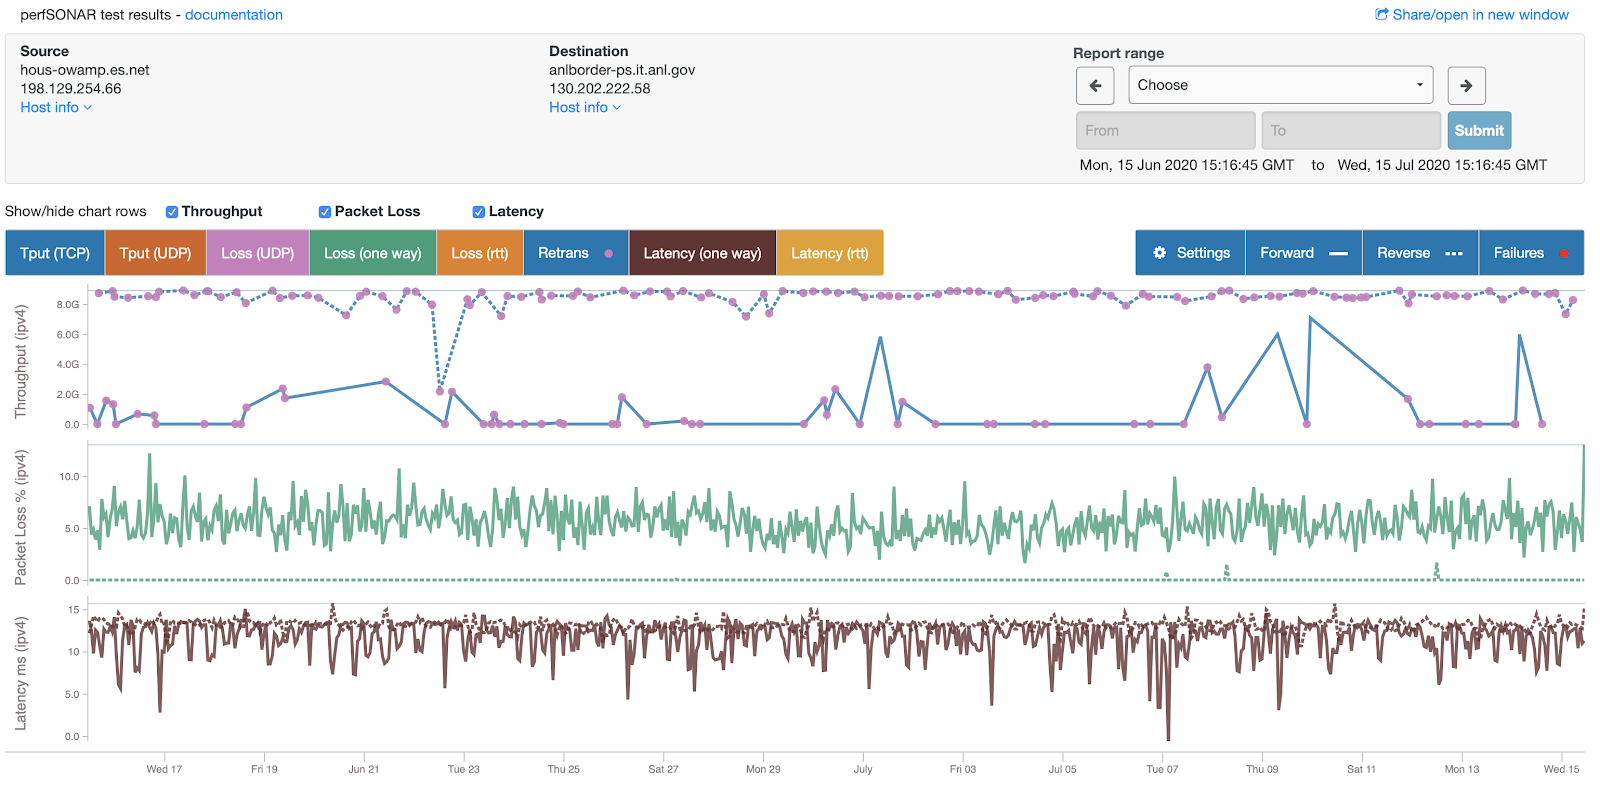
Example perfSONAR dashboard grid highlighting packet loss to an ANL test node (top). Example line graphs that further illustrate aspects of the problem (bottom).
While perfSONAR has had great success in providing the current set of capabilities, there is more that can be done. For example, perfSONAR is very good at correlating metrics it collects with the other perfSONAR metrics with at least one similar endpoint. But what if we want to correlate the metrics by location, intermediate network or with non-perfSONAR collected statistics like flow statistics and interface counters? These are all key questions the perfSONAR project is looking to answer.
Building upon a strong foundation
PerfSONAR has the ability to add analytics from other software tools using a plug-in framework. Recently, we have begun to use Elastic Search via this framework, to ingest log data and enable improved search and analytics on perfSONAR data.
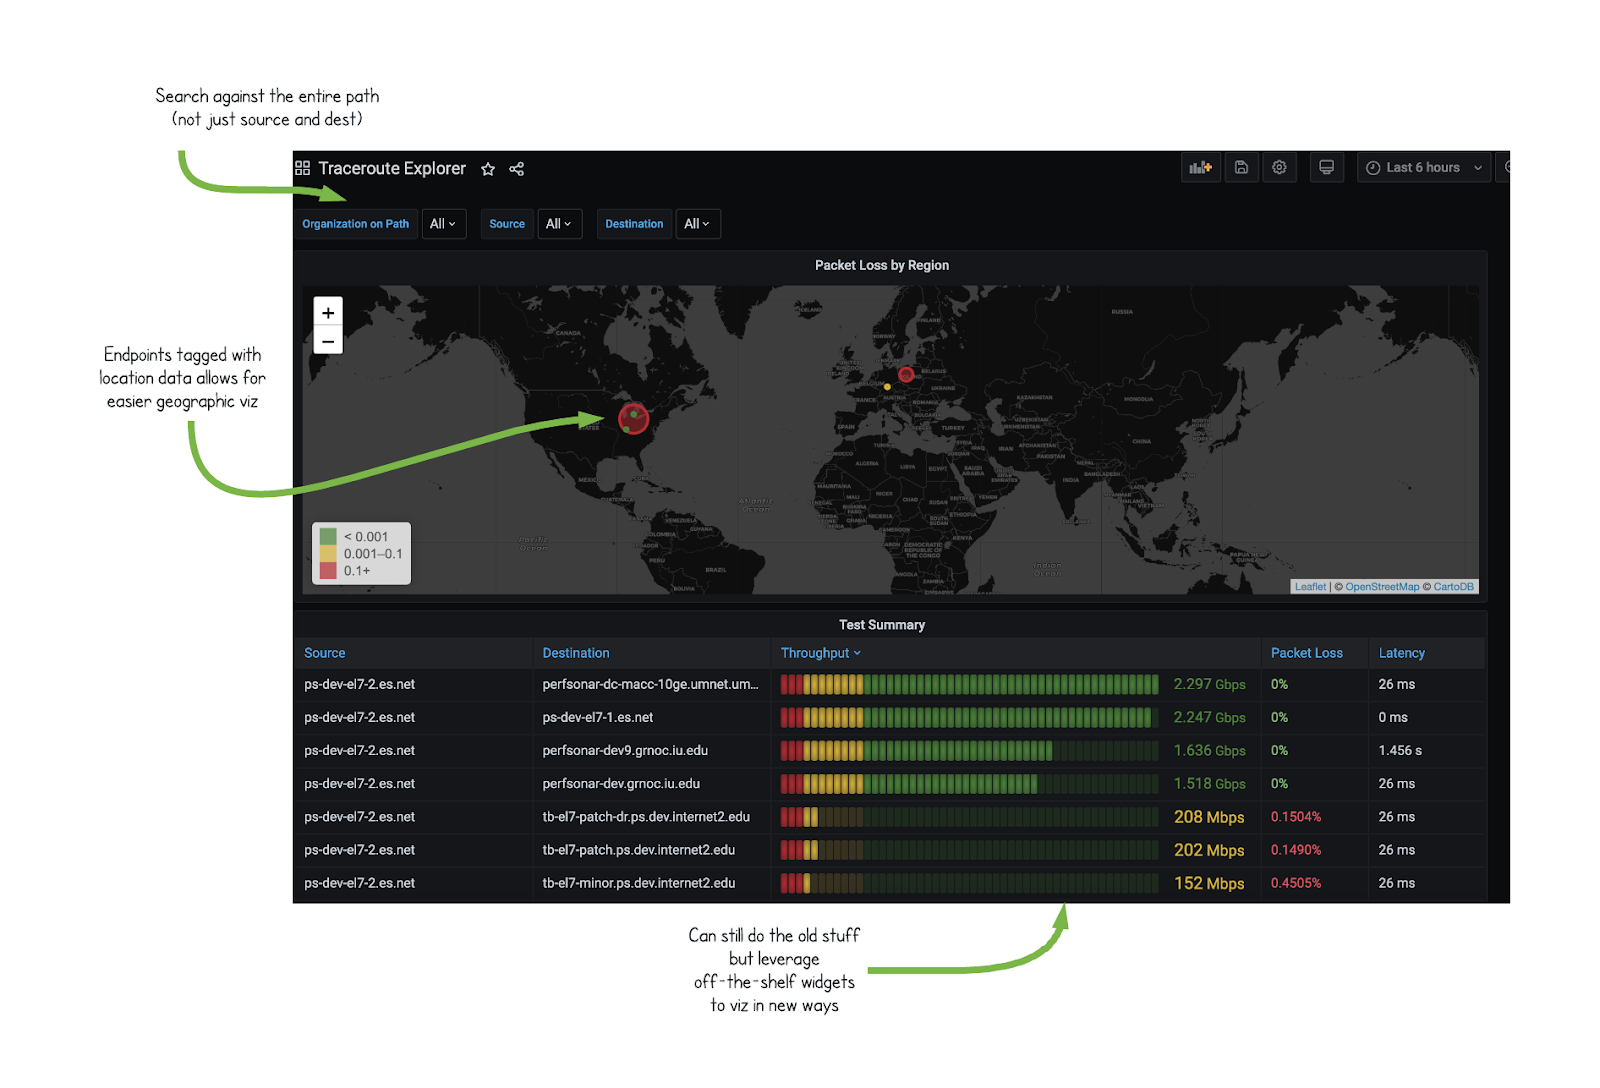
For example, traditionally perfSONAR has viewed an individual measurement as something between a pair of IP addresses. But what do these IP addresses represent and where are they located? Using off-the-shelf tools Elastic Search in combination with Logstash, perfSONAR is able to answer questions like “What geographic areas are showing the most packet loss?”.
Example map showing packet loss hotspots to different locations around the globe. It also contains a menu to filter results by intermediate network.
Additionally, we can apply this same principle to traceroute (and similar tools) that yield a list of IP addresses giving an idea of the path a measurement takes between source and destination. Each IP address is a key to more information about the path including not only geographic information but also the organization at each point. This means you can ask questions such as “What is the throughput of all results that transit a given organization?”. Previously a user would not only have to know the exact address of the IPs, but it would have to be the first (source) or last (destination) address in the path.
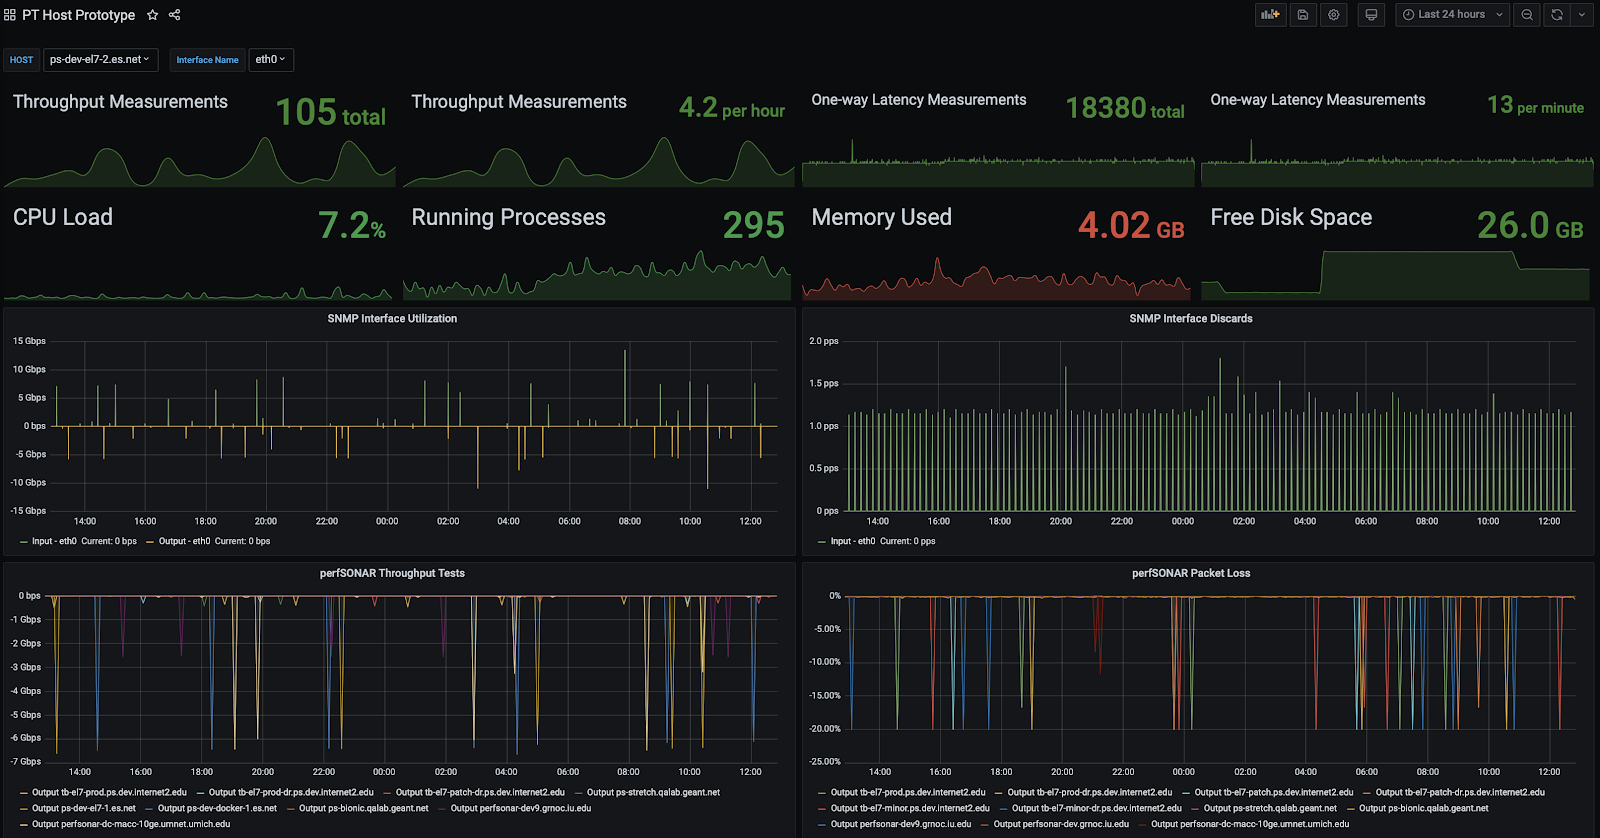
Integration with non-perfSONAR data is another area the project is looking to expand. By putting perfSONAR data in a well established data store like Elasticsearch, the door is open to leverage other off-the-shelf open source tools like Grafana to display results. What’s interesting about this platform is not only its ability to build new visualizations, but also the diverse set of backends it is capable of querying. If data such as host metrics, network interface counters and flow statistics are kept in any of the supported data stores, then there is a means to present this information along perfSONAR data.
Example of perfSONAR statistics combined with host statistics from a completely different database being displayed in Grafana
These efforts are very much still in their early stages of development, but initial indicators are promising. Leveraging the perfSONAR architecture in conjunction with the wealth of off-the-shelf open source tools available on the market today create opportunities to gain new insights from the network, like those described above, not previously possible with the traditional perfSONAR tools.
Getting involved and learning more
The perfSONAR project will continue to provide updates as this work progresses. You can also see the perfSONAR web site for updates and more information on keeping in touch through our mailing lists. The perfSONAR project looks forward to working with the community to provide exciting new network measurement capabilities.


You must be logged in to post a comment.