ESnet’s first 40 Gb/s public data transfer node (DTN) has been deployed and is now available for community testing. This new DTN is the first of a new generation of publicly available networking test units, provided by ESnet to the global research and engineering network community as part of promoting high-speed scientific data mobility. This 40G DTN will provide four times the speed of previous-generation DTN test units, as well as the opportunity to test a variety of network transfer tools and calibrated data sets.
The 40G DTN server, located at ESnet’s El Paso location, is based on an updated reference implementation of our Science DMZ architecture. This new DTN (and others that will soon follow in other locations) will allow our collaborators throughout the global research and engineering network community to test high speed, large, demanding data transfers as part of improving their own network performance. The deployment provides a resource enabling the global science community to reach levels of data networking performance first demonstrated in 2017 as part of the ESnet Petascale DTN project.
The El Paso 40G DTN has Globus installed for gridFTP and parallel file transfer testing. Additional data transfer applications may be installed in the future. To facilitate user evaluation of their own network capabilities ESnet Data Mobility Exhibition (DME), test data sets will be loaded on this new 40G DTN shortly.
All ESnet DTN public servers can be found at https://app.globus.org/file-manager. ESnet will continue to support existing 10G DTNs located at Sunnyvale, Starlight, New York, and CERN.
The full 40G DTN Reference architecture and more information on the design of these new DTN can be found here:
A second 40G DTN will be available in the next few weeks, and will be deployed in Boston. It will feature Google’s bottleneck bandwidth and round-trip propagation time (BBR2) software, allowing improved round-trip-time measurement and the ability for users to explore BBR2 enhancements to standard TCP congestion control algorithms.
In an upcoming blog post, I will describe the Boston/BBR2-enabled 40G DTN and perfSONAR servers. In the meantime, ESnet and the deployment team hope that the new El Paso DTN will be of great use to the global research community!
Scientific discovery increasingly relies on the ability to perform large data transfers across networks operated by many different providers (including ESnet) around the globe. But what happens when a researcher initiates one of these large data transfers and data movement is slow? What does “slow” even mean? These can be surprisingly complex questions and it is important to have the right tools to help answer them. perfSONAR is an open source software tool designed to measure network performance and pinpoint issues that occur as data travels across many different networks on the way to a destination.
perfSONAR has been around for more than 15 years and is primarily maintained today by a collaboration of ESnet, GEANT, Indiana University, Internet2, and the University of Michigan. perfSONAR has an active community that extends well beyond the five core organizations that maintain the software with more than 2000 public deployments that span six continents and hundreds of organizations. perfSONAR deployments are capable of scheduling and running tests that calculate metrics including (but not limited to) how fast a transfer can be performed (throughput), if a unit of information makes it to a desired destination (packet loss), if so how long did it take (latency) and what path did it take to get there (traceroute). What is novel about perfSONAR is not just these metrics, but the set of tools to feature these metrics in dashboards built by multiple collaborating organizations. These dashboards aim to clearly identify patterns that signify potential issues and provide the means to drill-down into graphs that give more information.
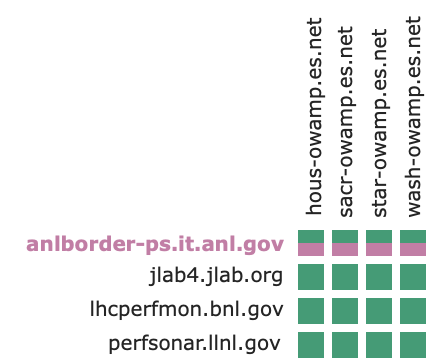
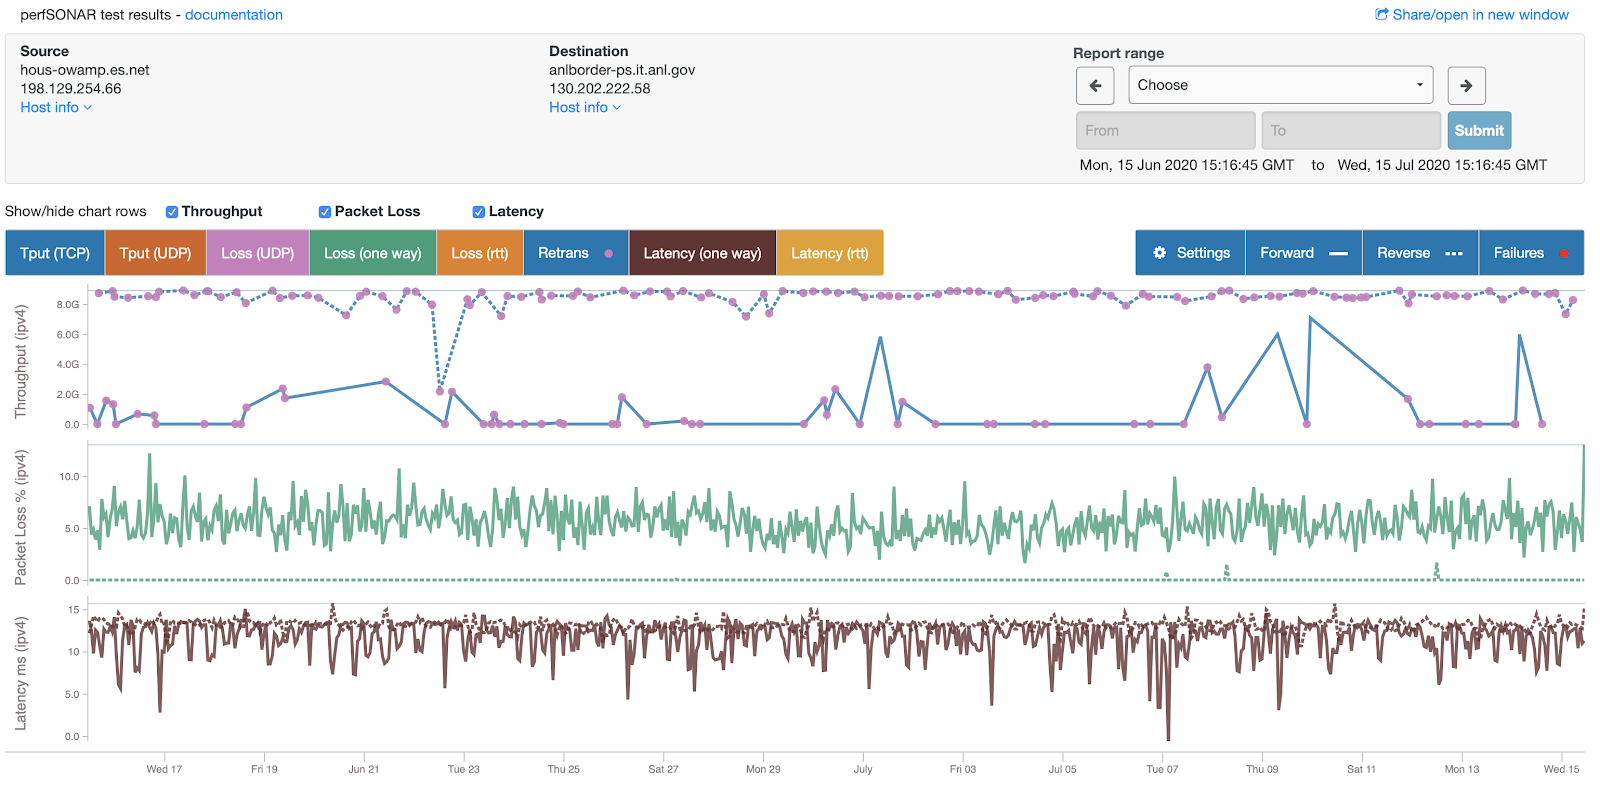
Example perfSONAR dashboard grid highlighting packet loss to an ANL test node (top). Example line graphs that further illustrate aspects of the problem (bottom).
While perfSONAR has had great success in providing the current set of capabilities, there is more that can be done. For example, perfSONAR is very good at correlating metrics it collects with the other perfSONAR metrics with at least one similar endpoint. But what if we want to correlate the metrics by location, intermediate network or with non-perfSONAR collected statistics like flow statistics and interface counters? These are all key questions the perfSONAR project is looking to answer.
Building upon a strong foundation
PerfSONAR has the ability to add analytics from other software tools using a plug-in framework. Recently, we have begun to use Elastic Search via this framework, to ingest log data and enable improved search and analytics on perfSONAR data.
For example, traditionally perfSONAR has viewed an individual measurement as something between a pair of IP addresses. But what do these IP addresses represent and where are they located? Using off-the-shelf tools Elastic Search in combination with Logstash, perfSONAR is able to answer questions like “What geographic areas are showing the most packet loss?”.
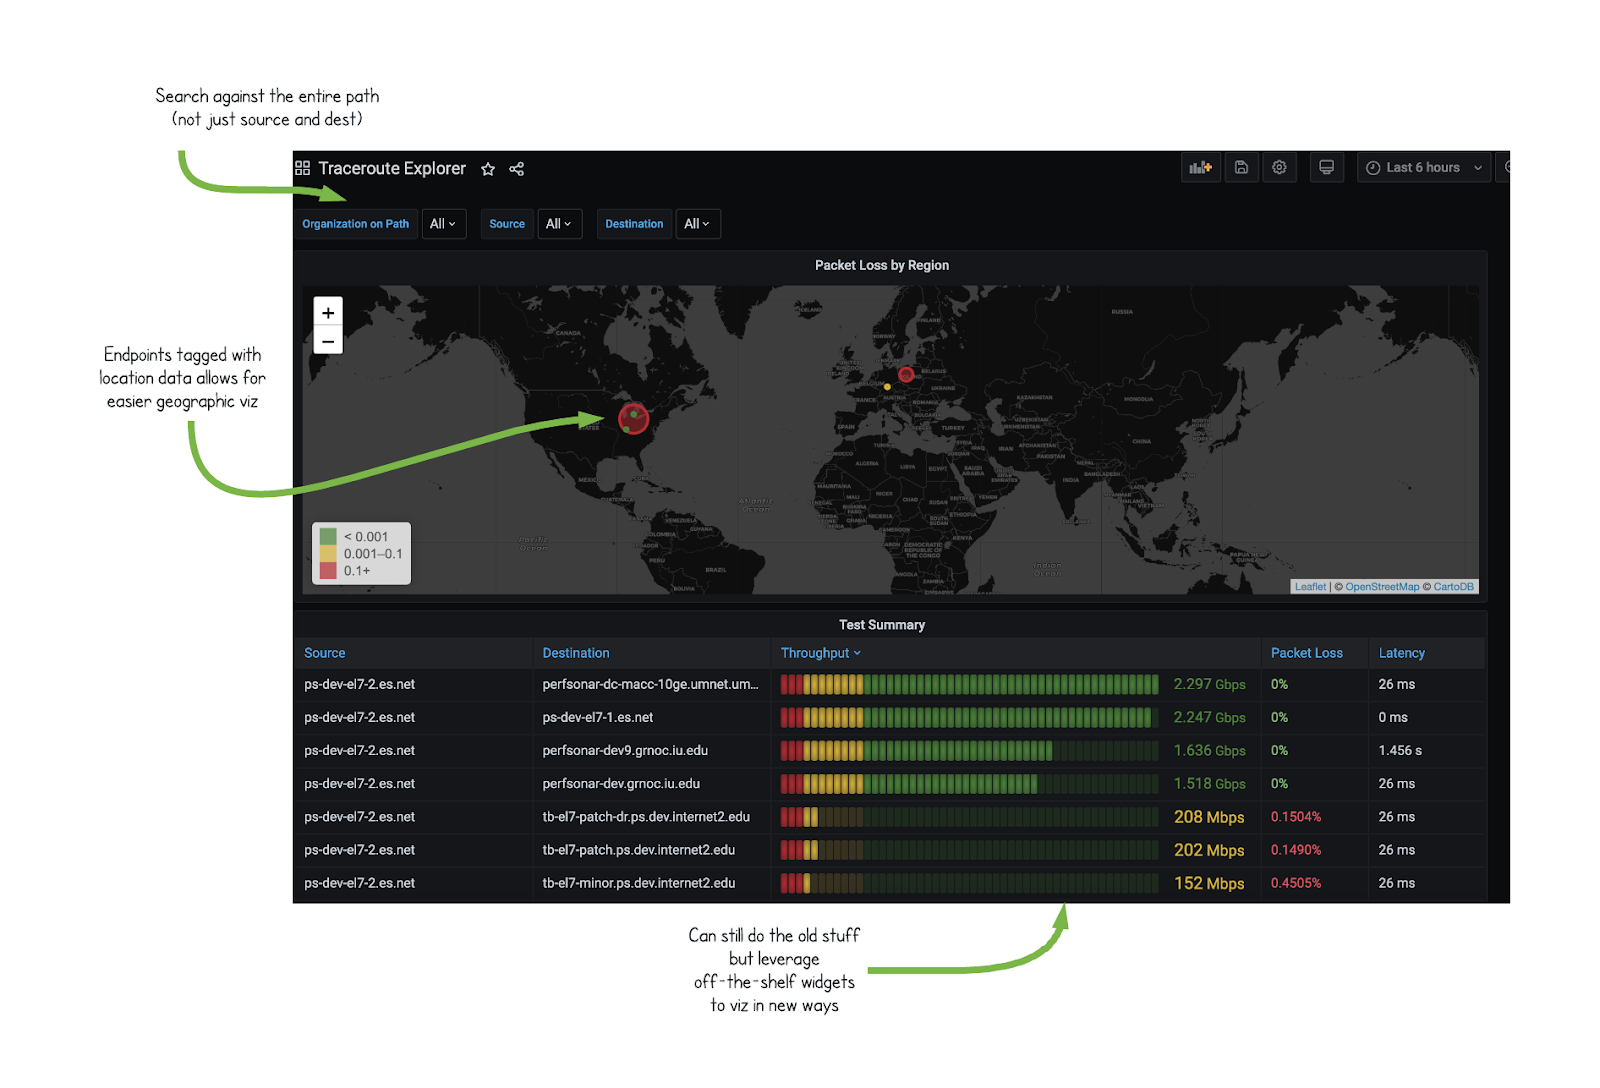
Example map showing packet loss hotspots to different locations around the globe. It also contains a menu to filter results by intermediate network.
Additionally, we can apply this same principle to traceroute (and similar tools) that yield a list of IP addresses giving an idea of the path a measurement takes between source and destination. Each IP address is a key to more information about the path including not only geographic information but also the organization at each point. This means you can ask questions such as “What is the throughput of all results that transit a given organization?”. Previously a user would not only have to know the exact address of the IPs, but it would have to be the first (source) or last (destination) address in the path.
Integration with non-perfSONAR data is another area the project is looking to expand. By putting perfSONAR data in a well established data store like Elasticsearch, the door is open to leverage other off-the-shelf open source tools like Grafana to display results. What’s interesting about this platform is not only its ability to build new visualizations, but also the diverse set of backends it is capable of querying. If data such as host metrics, network interface counters and flow statistics are kept in any of the supported data stores, then there is a means to present this information along perfSONAR data.
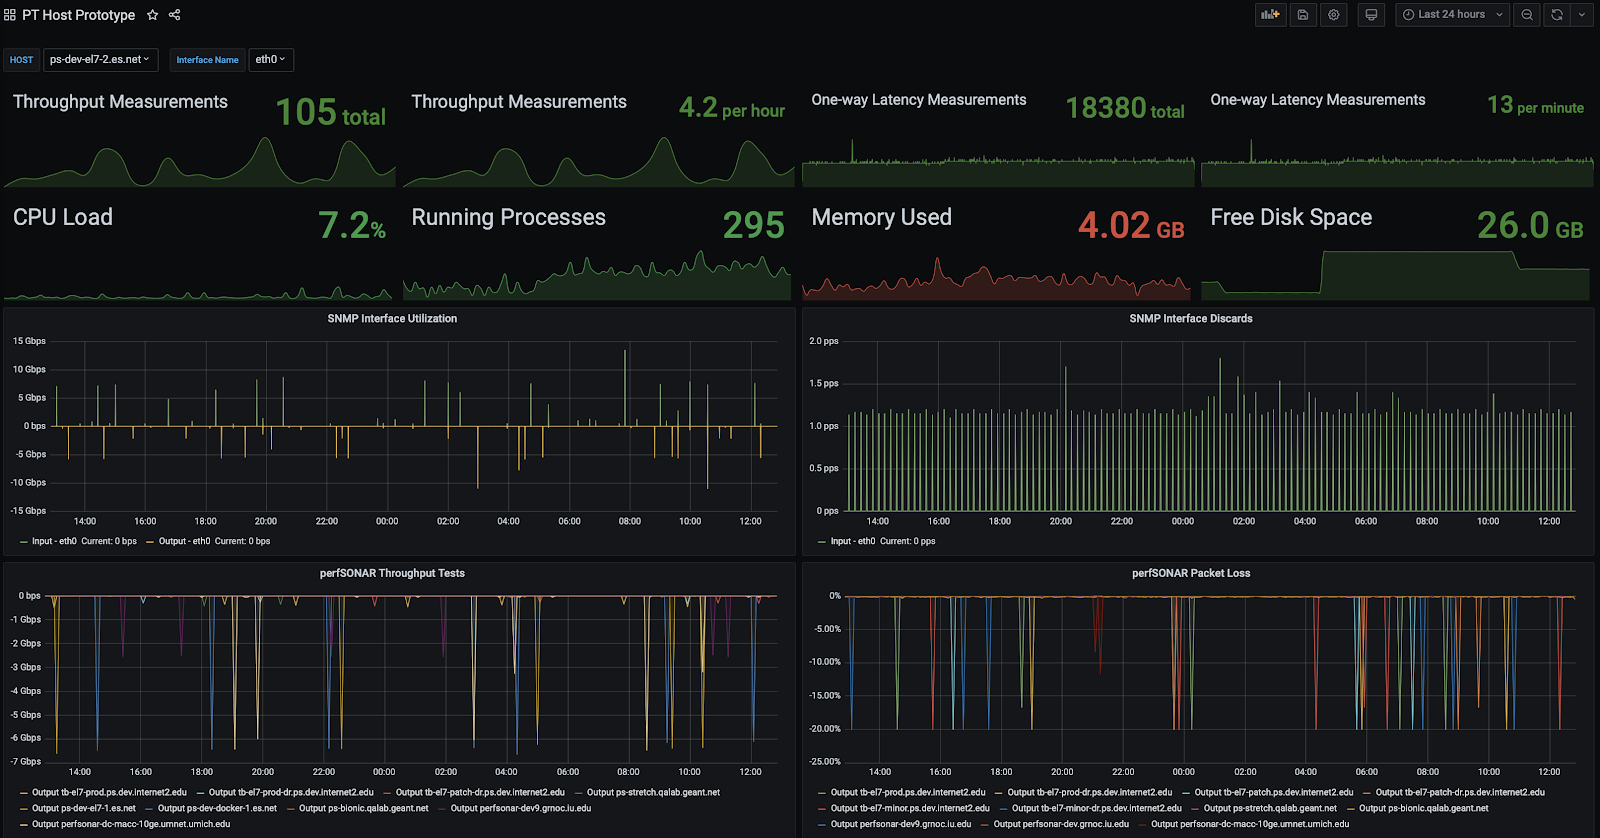
Example of perfSONAR statistics combined with host statistics from a completely different database being displayed in Grafana
These efforts are very much still in their early stages of development, but initial indicators are promising. Leveraging the perfSONAR architecture in conjunction with the wealth of off-the-shelf open source tools available on the market today create opportunities to gain new insights from the network, like those described above, not previously possible with the traditional perfSONAR tools.
Getting involved and learning more
The perfSONAR project will continue to provide updates as this work progresses. You can also see the perfSONAR web site for updates and more information on keeping in touch through our mailing lists. The perfSONAR project looks forward to working with the community to provide exciting new network measurement capabilities.
In my previous post, we discussed use of the open-source Zeek software to support network security monitoring at ESnet. In this post, I’ll talk a little about work underway to improve Zeek’s ability to support network traffic monitoring when faced with stream asymmetry.
This comes from recent work by two of my colleagues on the ESnet Security team.
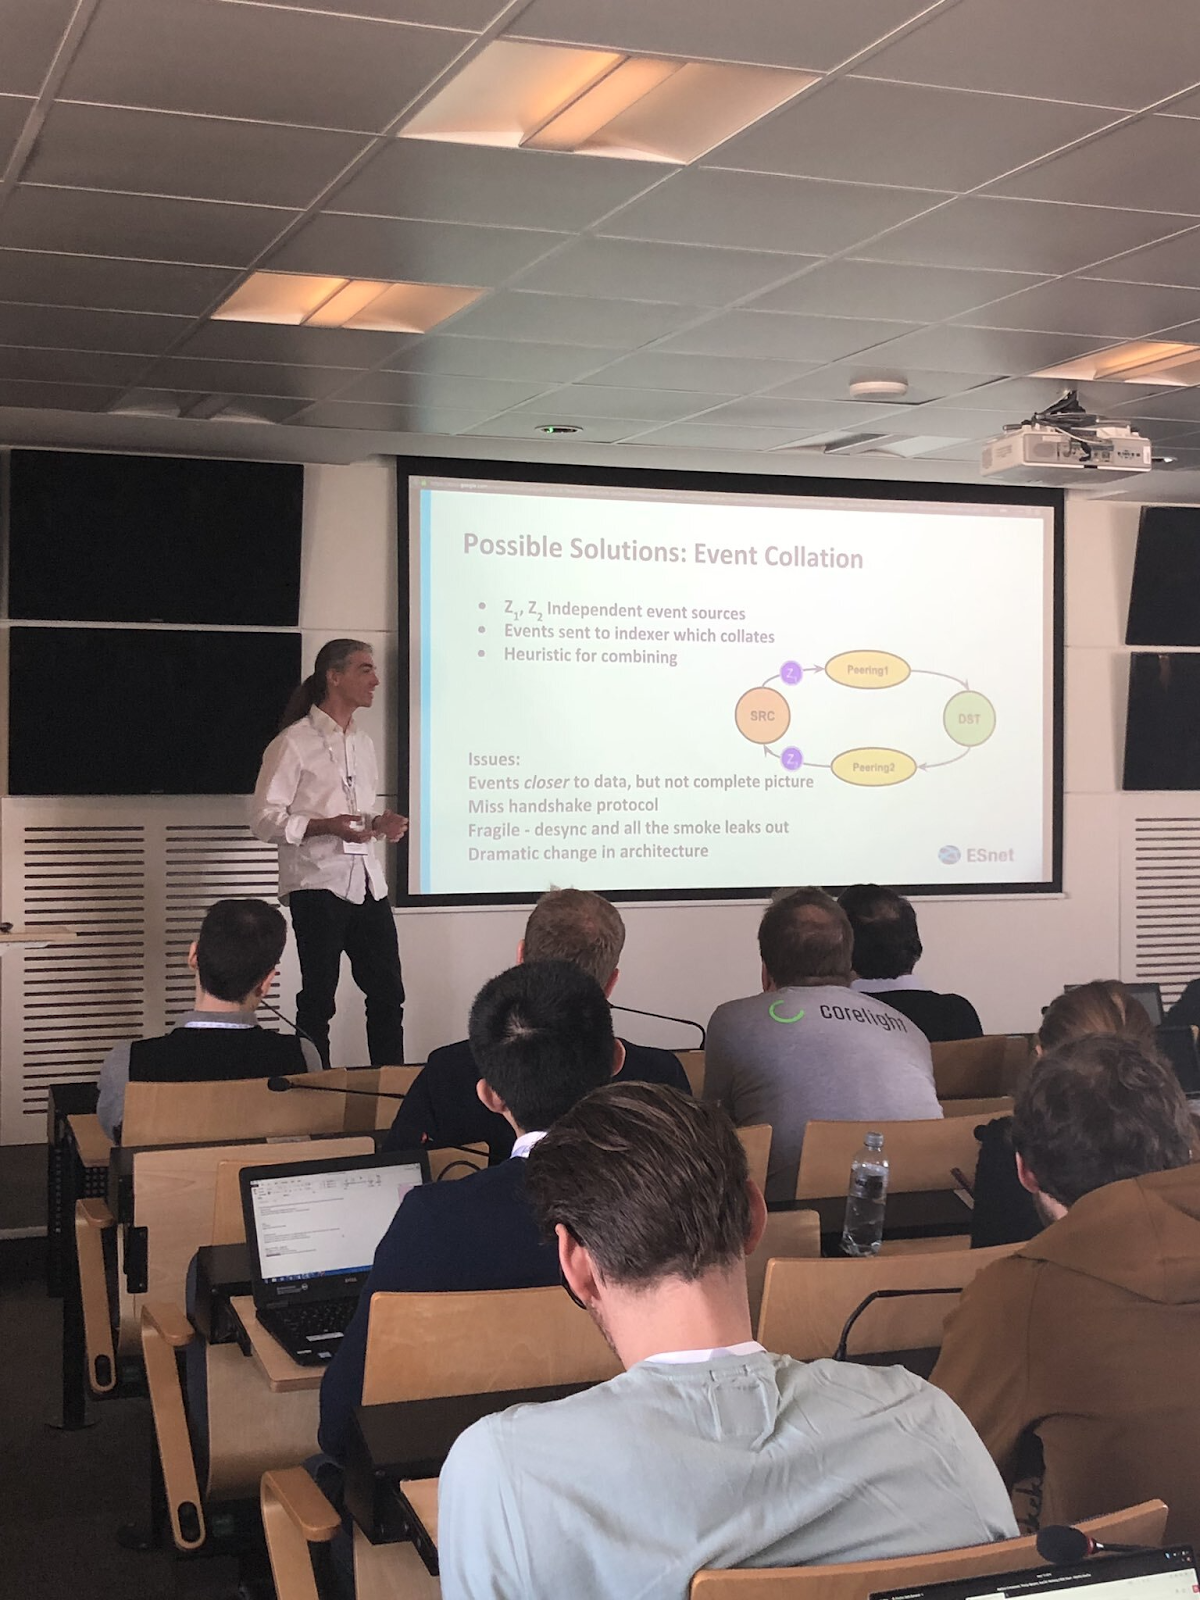
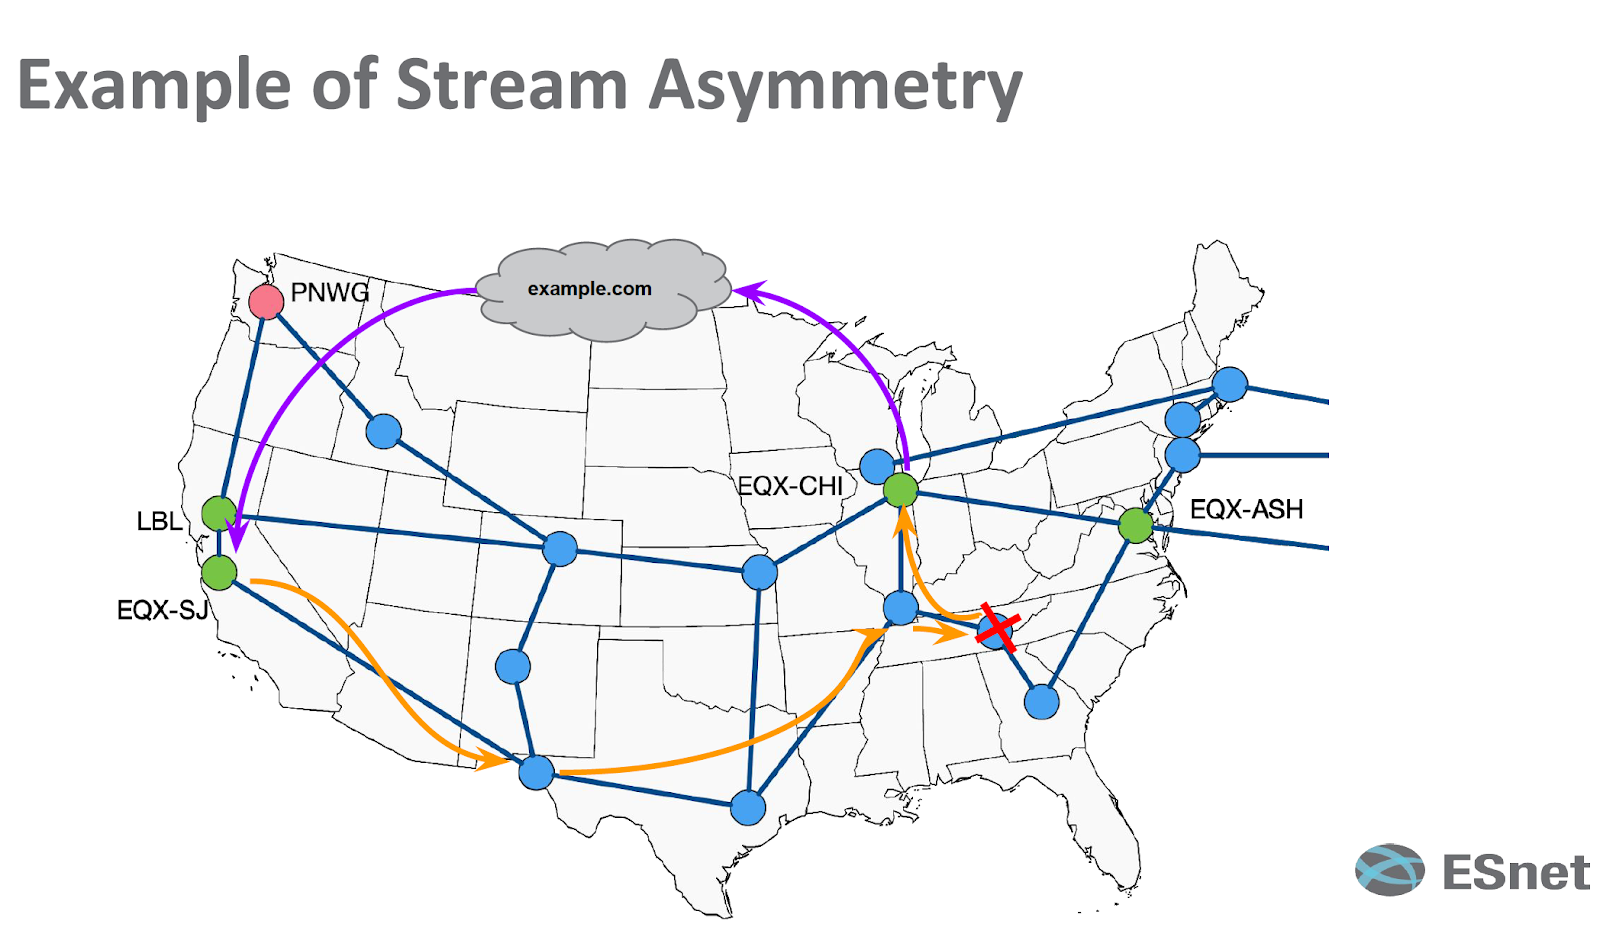
Scott Campbell at CERN presenting ‘Running Zeek on the WAN’The asymmetry problem on a WAN (example)
Some of the significant findings and results from this presentation are highlighted below:
Phase I: Initial Zeek Node Design Considerations
Select locations that provide an interesting network vantage point – in the case of our ESnet network, we deployed Zeek nodes on our commodity internet peerings (eqx-sj, eqx-chi, eqx-ash) since they represent the interface to the vast majority of hostile traffic.
Identifying easy traffic to test with and using spanning ports to forward traffic destined to the stub network on each of the routers used for collection.
Phase I: Initial Lessons learned from testing and results
Some misconfigurations were found in the ACL prefix lists.
We increased visibility into our WAN side traffic through implementation of new background methods.
Establishing a new process for end-to-end testing, installing and verifying Zeek system reporting.
Phase II: Prove there is more useful data to be seen
For phase II we moved towards collection of full peer connection records, from statistical sampling based techniques. Started running Zeek on traffic crossing the interfaces which connect ESnet network peers to the internet from the AS (Autonomous system) responsible for most notices. .
To get high fidelity connection information without being crushed by data volume, define a subset of packets that are interesting – zero length control packets (Syn/Syn-Ack/Fin/Rst) from peerings.
Phase II: Results
A lot of interesting activity got discovered like information leakage in syslogs, logins (and attempted logins) using poorly secure authentication protocols, and analysis of the amount of asymmetric traffic patterns gave valuable insights to understand better the asymmetric traffic problems.
Ongoing Phase III: Expanding the reach of traffic collection on WAN
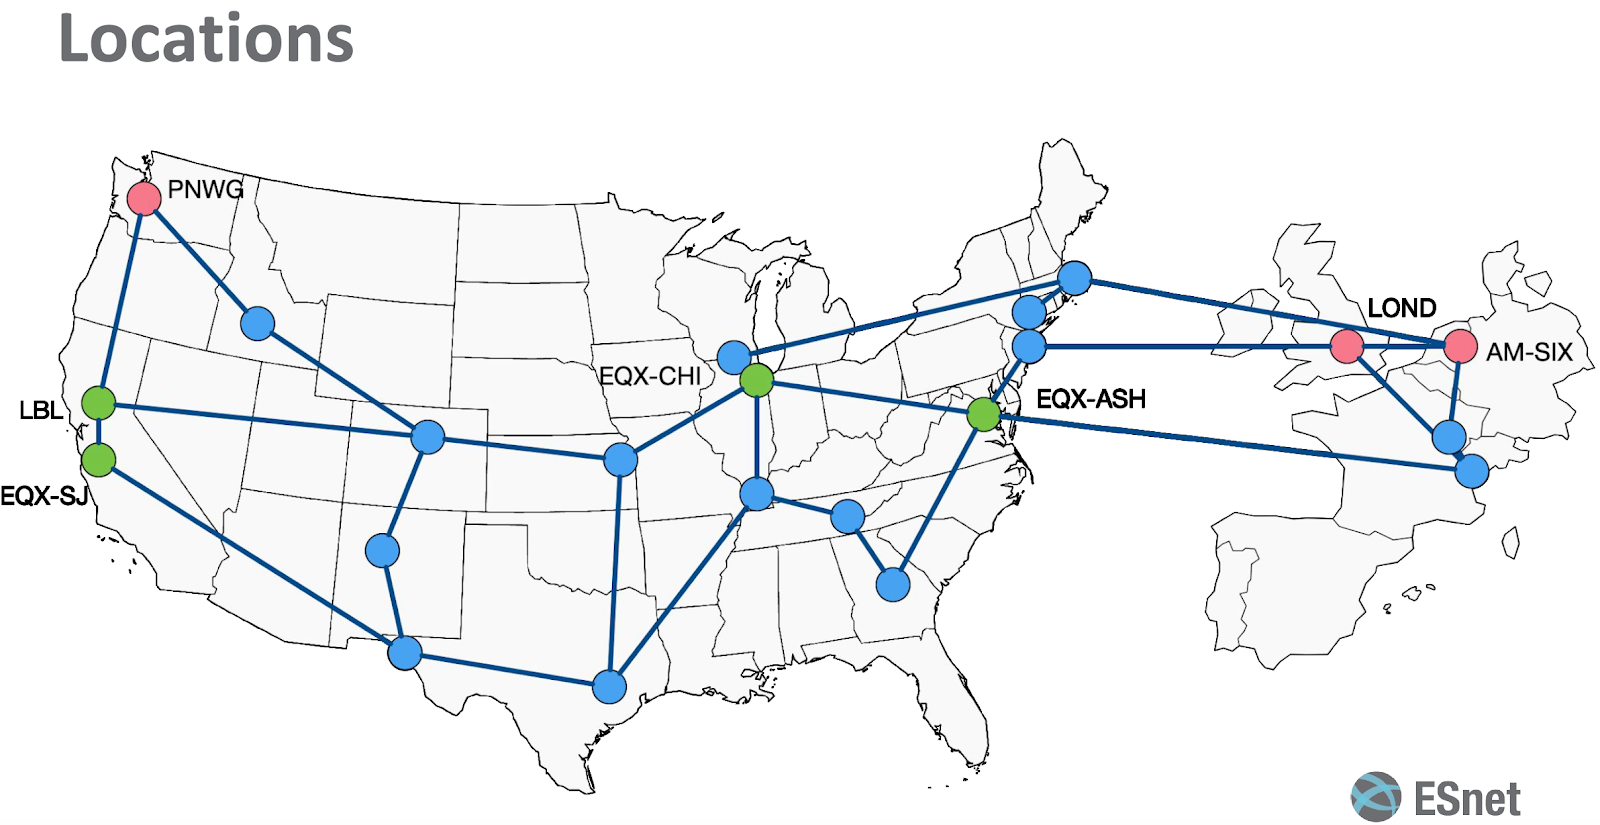
We are currently in the process of deploying Zeek nodes at another three WAN locations for monitoring commodity internet peering – PNWG (peering at Seattle WA), AM-SIX (peering at Amsterdam) and LOND (peering at London)
Locations for the ZoW systems, the pink shows ongoing Phase III deployment
As our use of Zeek on the WAN side of ESnet continues to grow, the next phase to the ZoW pilot is currently being defined. We’re working to incorporate these lessons learned on how to handle traffic asymmetry into these next phases of effort.
Some (not all) solutions being taken into consideration include:
Aggregating traffic streams at a central location to make sense out of the asymmetric packet streams and then run Zeek on the aggregated traffic, or
Running Zeek on the individual asymmetric streams and then aggregating these Zeek streams @ 5-tuple which will be aggregation of connection metadata rather than the connection stream itself.
We are currently exploring these WAN solutions as part of providing better solutions to both ESnet, and connected sites.


You must be logged in to post a comment.